

Filtering to one agent, walking through the sections, then clicking Calls connected to open the calls in Logs
Filters
Click Filters in the page header. Each section shows a dot when it is set, and active filters appear as chips you can click to edit or remove. Reset clears them all.
Filters live in the page URL, so you can bookmark or share a filtered view. Analytics on a campaign’s detail panel opens this page at
/analytics?bulk_list_id=<campaign ID> (see Manage a campaign).
Volume
Eight cards. Each card except Numbers used has a change badge: the relative change against the period of the same length just before the selected range, with the same filters (1–30 Sep compares with 2–31 Aug). For rates such as Connectivity rate, the badge is a relative % change, not percentage points. There is no badge when the previous period had no calls, when the change is under 0.1%, or when a campaign is selected. Hover a value for the exact number.
Below the cards, a trend chart plots calls per hour, day, week or month, depending on the range. Total calls and Connected are shown by default. Click Failed, Cancelled, Registered, Ongoing or Retry in the legend to add their lines.
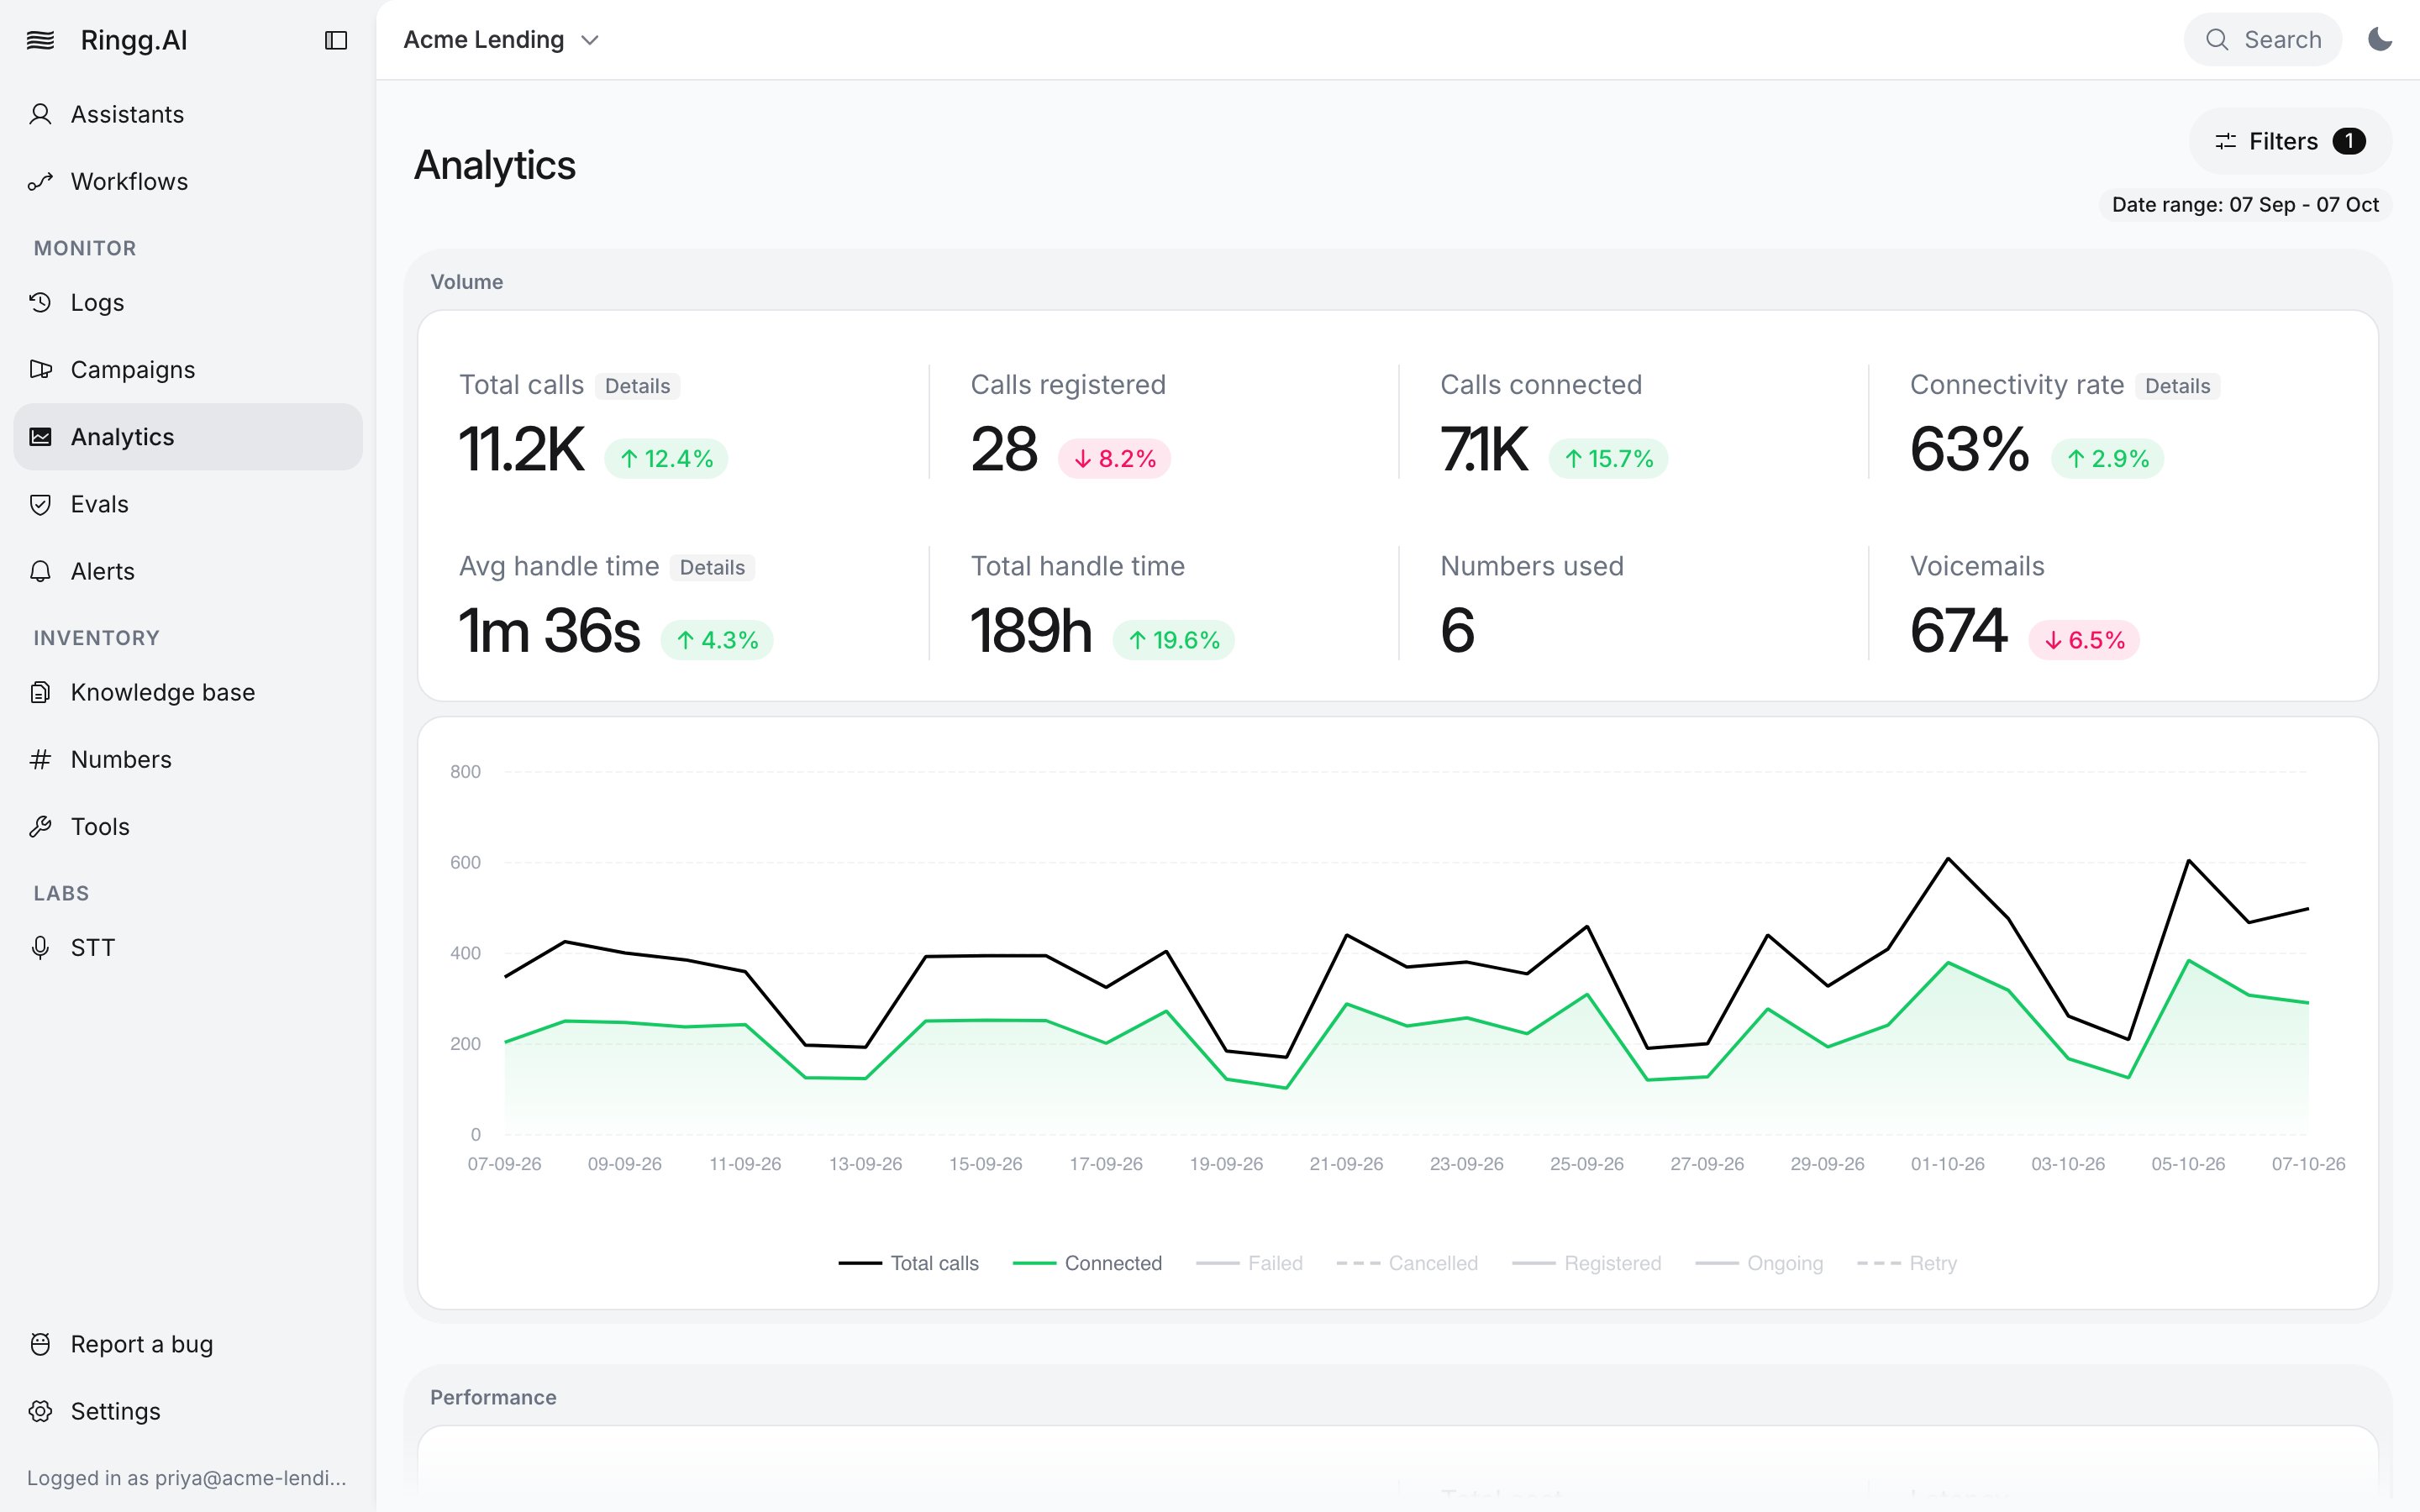
The Volume section
Performance
Goal achieved and Cost per goal appear only after you pick an agent or a campaign. Until then the card reads “Pick an agent to see goal metrics”; click agent to open the filter.
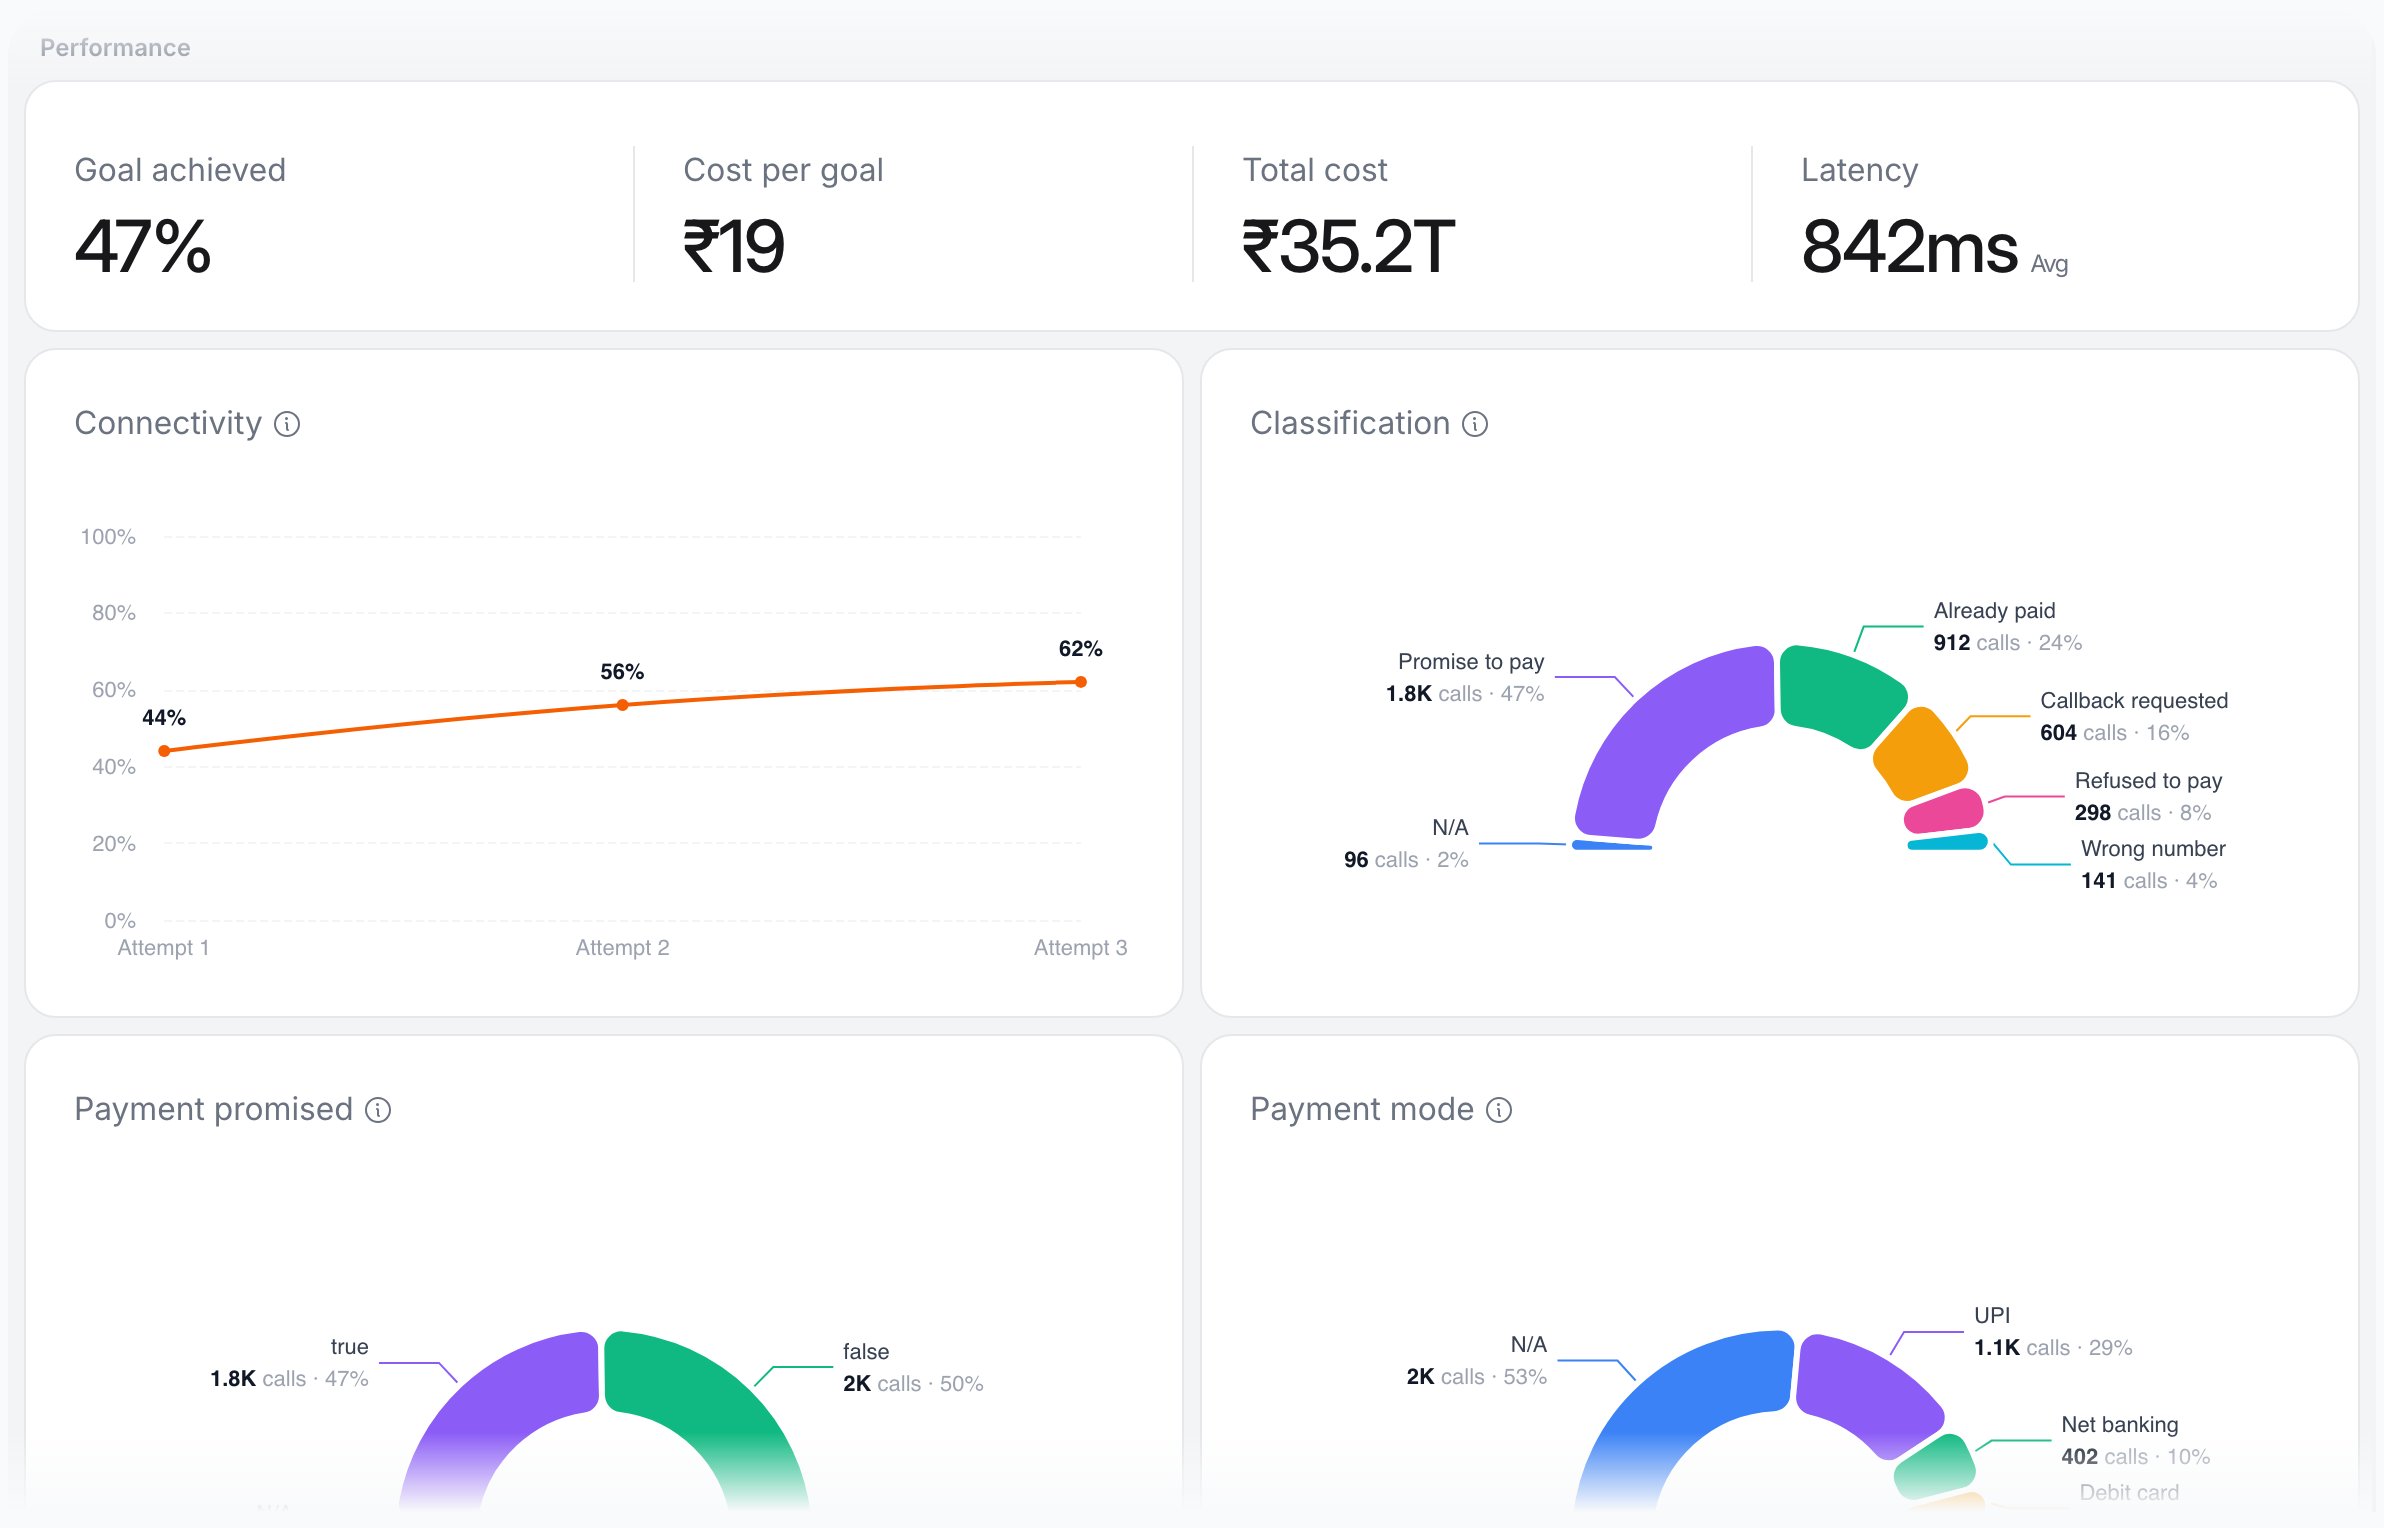
The Performance section for one agent
Where the goal comes from
The goal is a Boolean field in the agent’s Advanced Analysis. When you add or edit a Boolean variable there, turn on Use as goal (“Used by analytics to calculate your agent’s success rate.”). One variable per agent can be the goal, and it is marked Goal in the variables table. Only Boolean variables qualify. The goal is set per version, and each call is judged against its own version’s goal. With several agents selected, Goal achieved pools them; calls of versions with no goal are left out. Calls on archived versions don’t count toward it.Connectivity
A line chart of cumulative connectivity per attempt (Attempt 1, Attempt 2 and so on): the share of calls connected by the end of that attempt. Hover a point to see that attempt’s attempted and connected counts. Use it to judge whether more retries are worth it; retries are set on the campaign or workflow Agent block.Cohort analysis
One half-donut per category, showing how connected calls split across its values (top six; N/A means the value was missing). Categories are your agent’s Boolean and enum Advanced Analysis variables. Hover a slice for connected calls and average handle time. Text and number fields are not charted.Call limits
Four counts from your call limits.Agents table
One row per agent active in scope, with Assistant, Calls, Connected, Minutes and Cost. Rows start sorted by Calls; click any number column to sort. The top value in each column is bold.Trends
usage plots Paid (“concurrency your workspace bought”) against Received (“what you used, or the most we could serve”). It follows the date range, campaign and workspace filters only, not agent or channel. Raise paid concurrency on Billing. In a primary workspace, split it across Ringg Spaces.Drill down into Logs
Some figures open Logs with the matching filters. The pointer changes shape over a clickable item.
Every drill-down keeps the page’s date range, agents, versions, campaigns and workspaces. A channel carries over only when exactly one is selected. Only voicemail carries over; Exclude voicemail and Include callbacks do not, because Logs has no matching filter. Other cards, the connectivity chart, call limits and concurrency are not clickable.
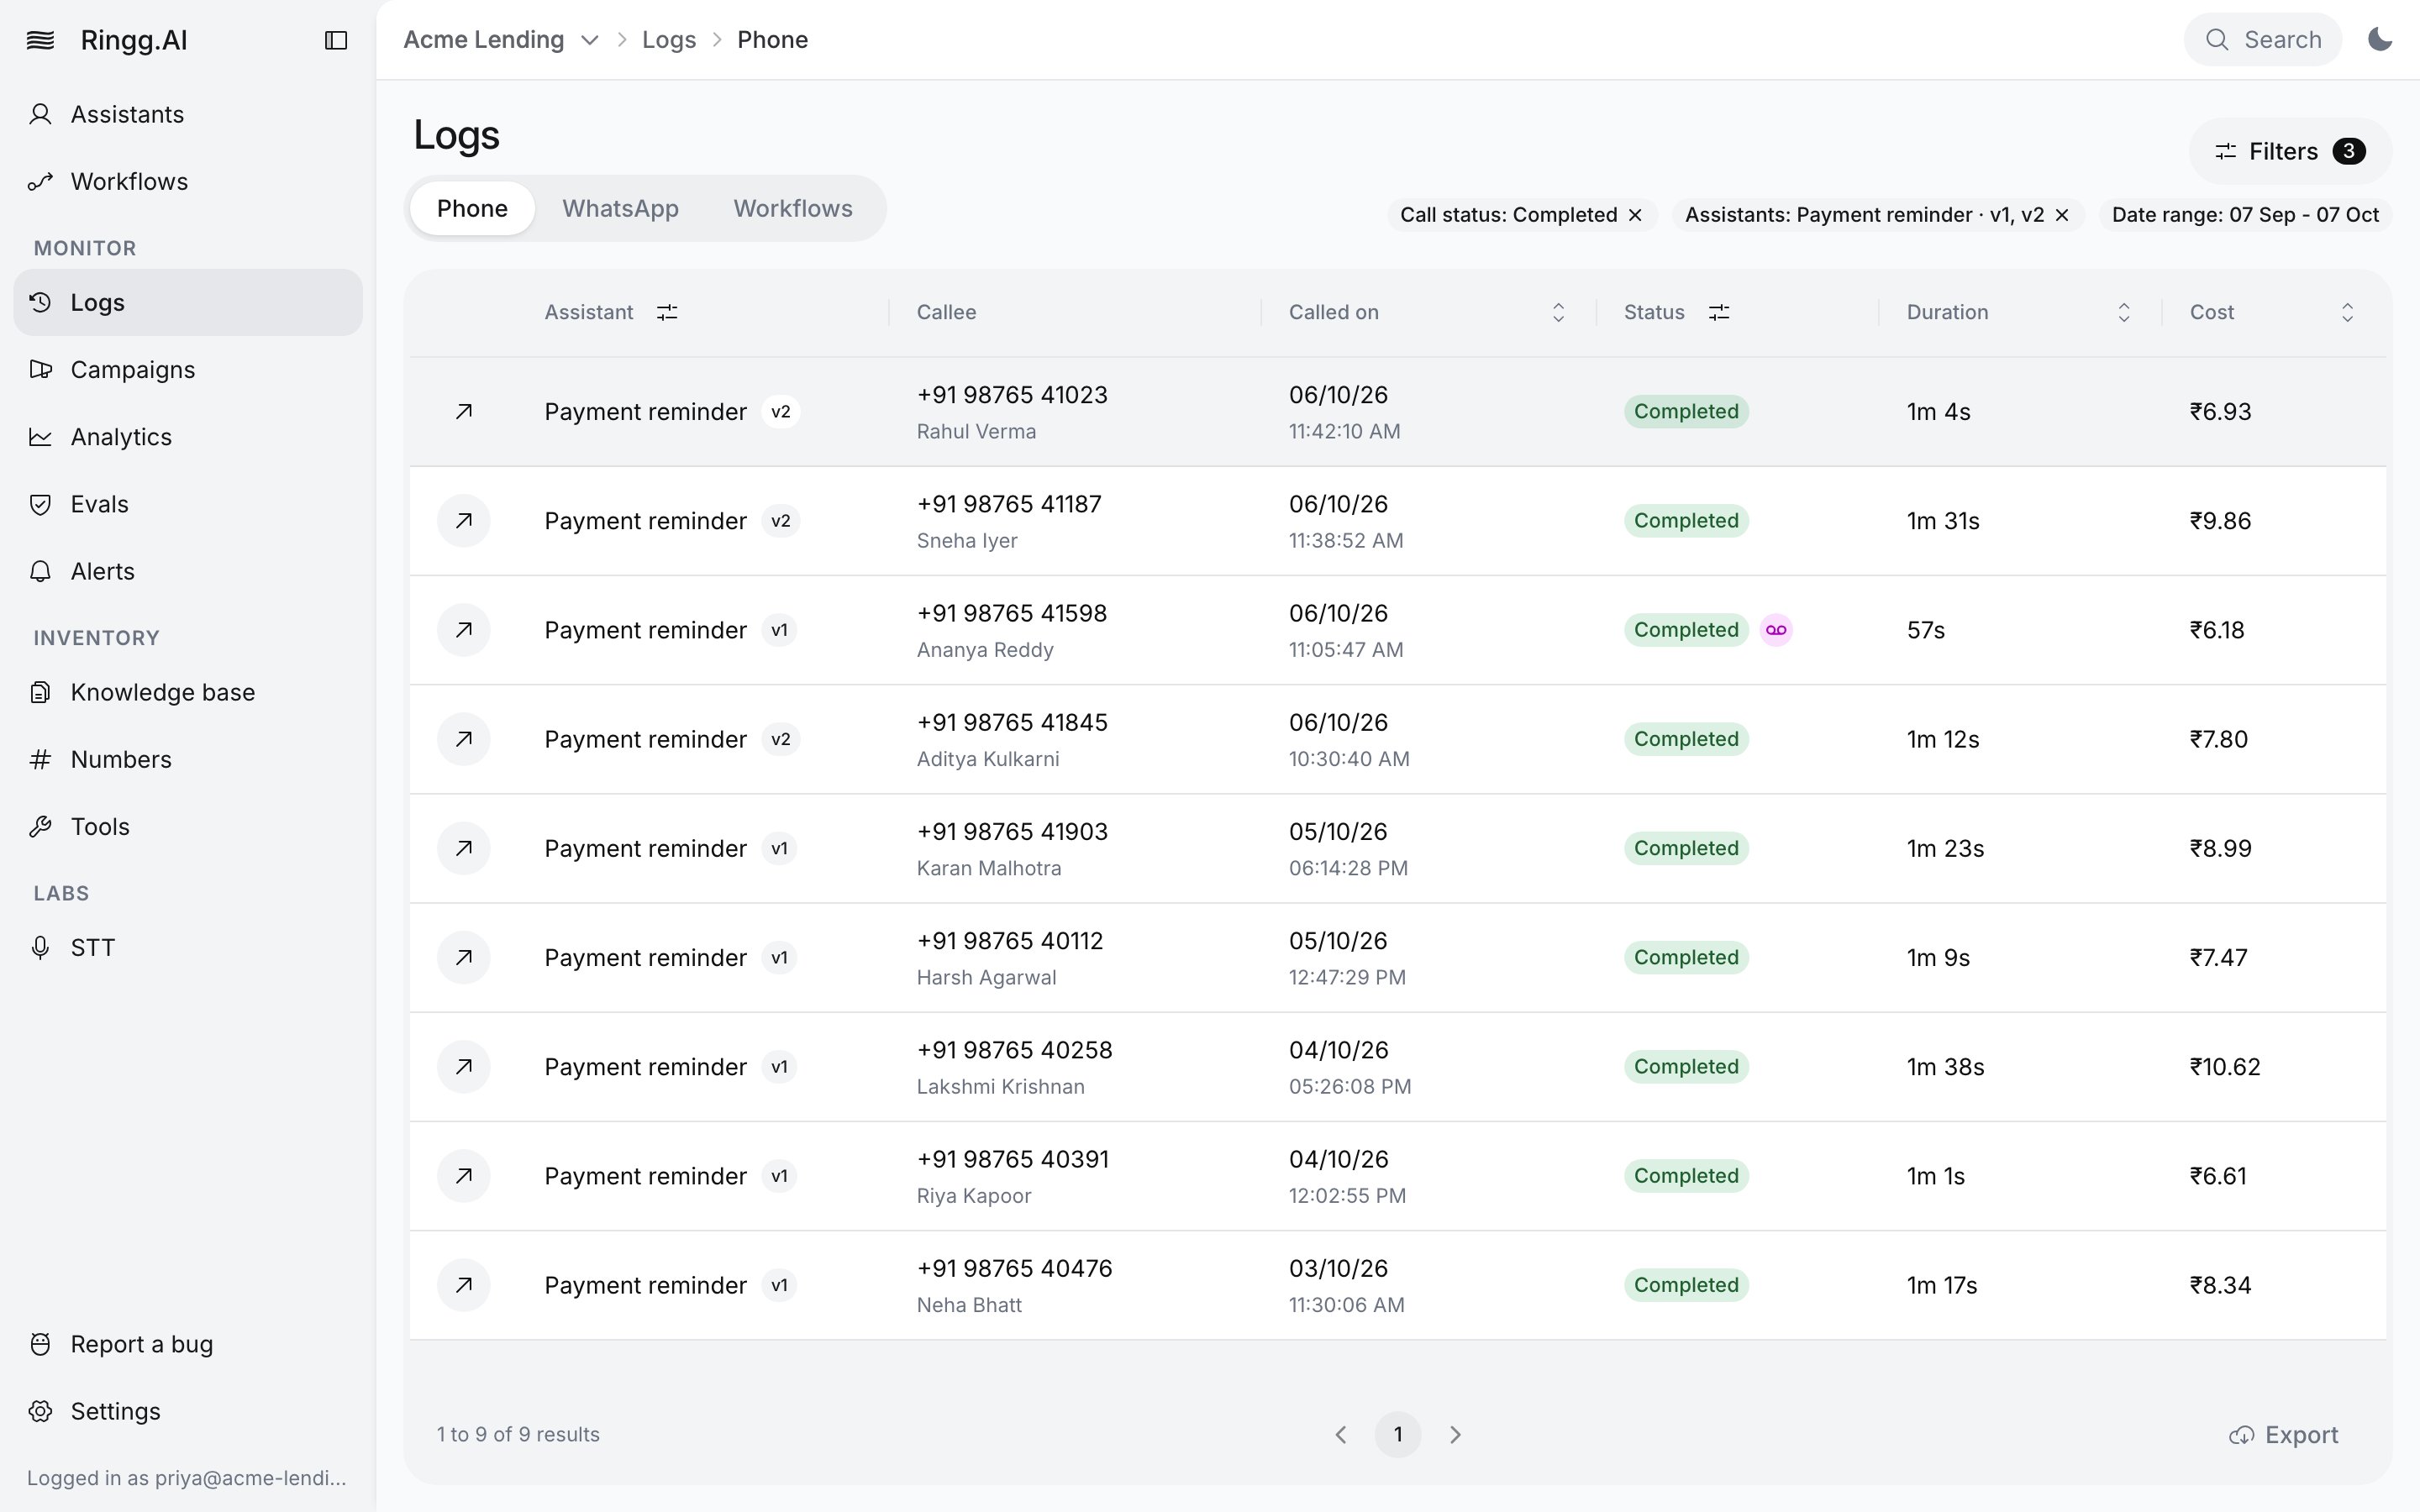
Logs opened from Calls connected
Act on what you see
Download report and Share feedback
- Download report (bottom right) saves the whole page as a PDF with the current filters and theme, named
analytics-report-<from>-to-<to>.pdf, oranalytics-report-campaign.pdfwhen a campaign is selected. - Share feedback opens a drawer: write in Your suggestion (“Any metric or chart you wish existed.”) and click Share.
With the API
The public API has five analytics endpoints. Each takesstart_date and end_date (YYYY-MM-DD), agent_id, bulk_list_id and voicemail. They don’t match the dashboard cards: they leave out Cancelled and Error calls, include callbacks, count unique numbers actually used, and have no registered count, change, goal, cost or latency figures. Expect their totals to differ from the page.
- Get Platform Analytics: workspace summary metrics.
- Get Drill-Down Analytics: one campaign (
bulk_list_idrequired). - Get Number Analytics: metrics per phone number.
- Get Duration Distribution: call duration buckets.
- Get Classification Analytics: calls by outcome classification.
X-API-KEY (see Authentication). Get an agent’s ID from Find an agent’s ID.
Troubleshooting
Goal achieved and Cost per goal are missing
Goal achieved and Cost per goal are missing
Pick an agent or a campaign in Filters. If they show
-, the agent has no goal: set Use as goal on a Boolean variable in Advanced Analysis. Cost per goal also shows - when no call achieved the goal.The date range disappeared after I picked a campaign
The date range disappeared after I picked a campaign
A campaign scopes the page to all its calls, whenever they happened. Remove the campaign to filter by date again.
The numbers differ from my Logs export
The numbers differ from my Logs export
Check Callbacks: Analytics leaves callback calls out unless Include callbacks is ticked. Also check the timezone: Analytics uses your browser’s.
A cohort slice is not clickable
A cohort slice is not clickable
Select exactly one agent. N/A slices never open Logs.
Next steps
Grade call quality
Score calls and run test cases with Evals.
Get alerted on a spike
Notify your team when a metric crosses a threshold.