> ## Documentation Index
> Fetch the complete documentation index at: https://docs.ringg.ai/llms.txt
> Use this file to discover all available pages before exploring further.
> ## Agent Instructions
> To search or read these docs, connect the Ringg docs MCP server at https://docs.ringg.ai/mcp (no key needed; tools search_ringg_ai and query_docs_filesystem_ringg_ai) instead of browsing pages one by one. Setup for each client: https://docs.ringg.ai/resources/mcp-server/docs-mcp-server/mcp-for-ai-assistants.md
> The dashboard labels agents "Assistants"; these docs say "agent". Both mean the same object, identified by agent_id.
> API base URL: https://prod-api.ringg.ai/ca/api/v0. Send the workspace API key in the X-API-KEY header, from server-side code only.
> Placing a call dials a real phone number and spends credits. Confirm the number with the user before calling.
> To act on a Ringg workspace (place calls, edit agents, read transcripts), use the separate Ringg workspace MCP server at https://mcp.ringg.ai/mcp: https://docs.ringg.ai/resources/mcp-server/workspace-mcp-server/overview.md
# Analytics
> Read Ringg AI call analytics: filter by agent, campaign or channel, read volume, goal, connectivity and cost metrics, then drill into matching calls in Logs.
Analytics fills in once your agents place or answer calls. Use it for trends across many calls; open [Logs](/documentation/monitor/logs) for one call's transcript or recording. It covers calls only: WhatsApp and web chats are not counted.
In the dashboard: **Sidebar → Monitor → Analytics**.
## Filters
Click **Filters** in the page header. Each section shows a dot when it is set, and active filters appear as chips you can click to edit or remove. **Reset** clears them all.
| Section | Options | Notes |
| - | - | - |
| **Date range** | **Today**, **Week** (last 7 days), **Month**, or any range on the calendar | Default is the last month up to today. Dates use your browser's timezone, and a call falls on the date it was created. |
| **Assistants** | Search and tick [agents](/documentation/build-agents/agents/agent-types); each agent lists its [versions](/documentation/build-agents/test-and-improve/drafts-and-versions) | Ticking an agent selects all its versions. Untick versions to compare one. |
| **Campaigns** | Search and tick [campaigns](/documentation/deploy/campaigns/overview) | Selecting a campaign drops the date range: the page covers all of that campaign's calls. |
| **Channels** | **Outbound**, **Inbound**, **Webcall** | Inbound calls come from [attached numbers](/documentation/inventory/phone-numbers/inbound-agent-number); webcalls from the [web widget](/documentation/deploy/web-and-apps/web-widget/overview). |
| **Voicemail** | **All calls**, **Exclude voicemail**, **Only voicemail** | |
| **Callbacks** | **Include callbacks** | Off by default, so callback calls are left out of every metric. |
| **Workspaces** | Your Ringg Spaces | Shown only in a primary workspace with [Ringg Spaces](/documentation/manage-account/ringg-spaces/overview). |
Filters live in the page URL, so you can bookmark or share a filtered view. **Analytics** on a campaign's detail panel opens this page at `/analytics?bulk_list_id=` (see [Manage a campaign](/documentation/deploy/campaigns/manage-a-campaign)).
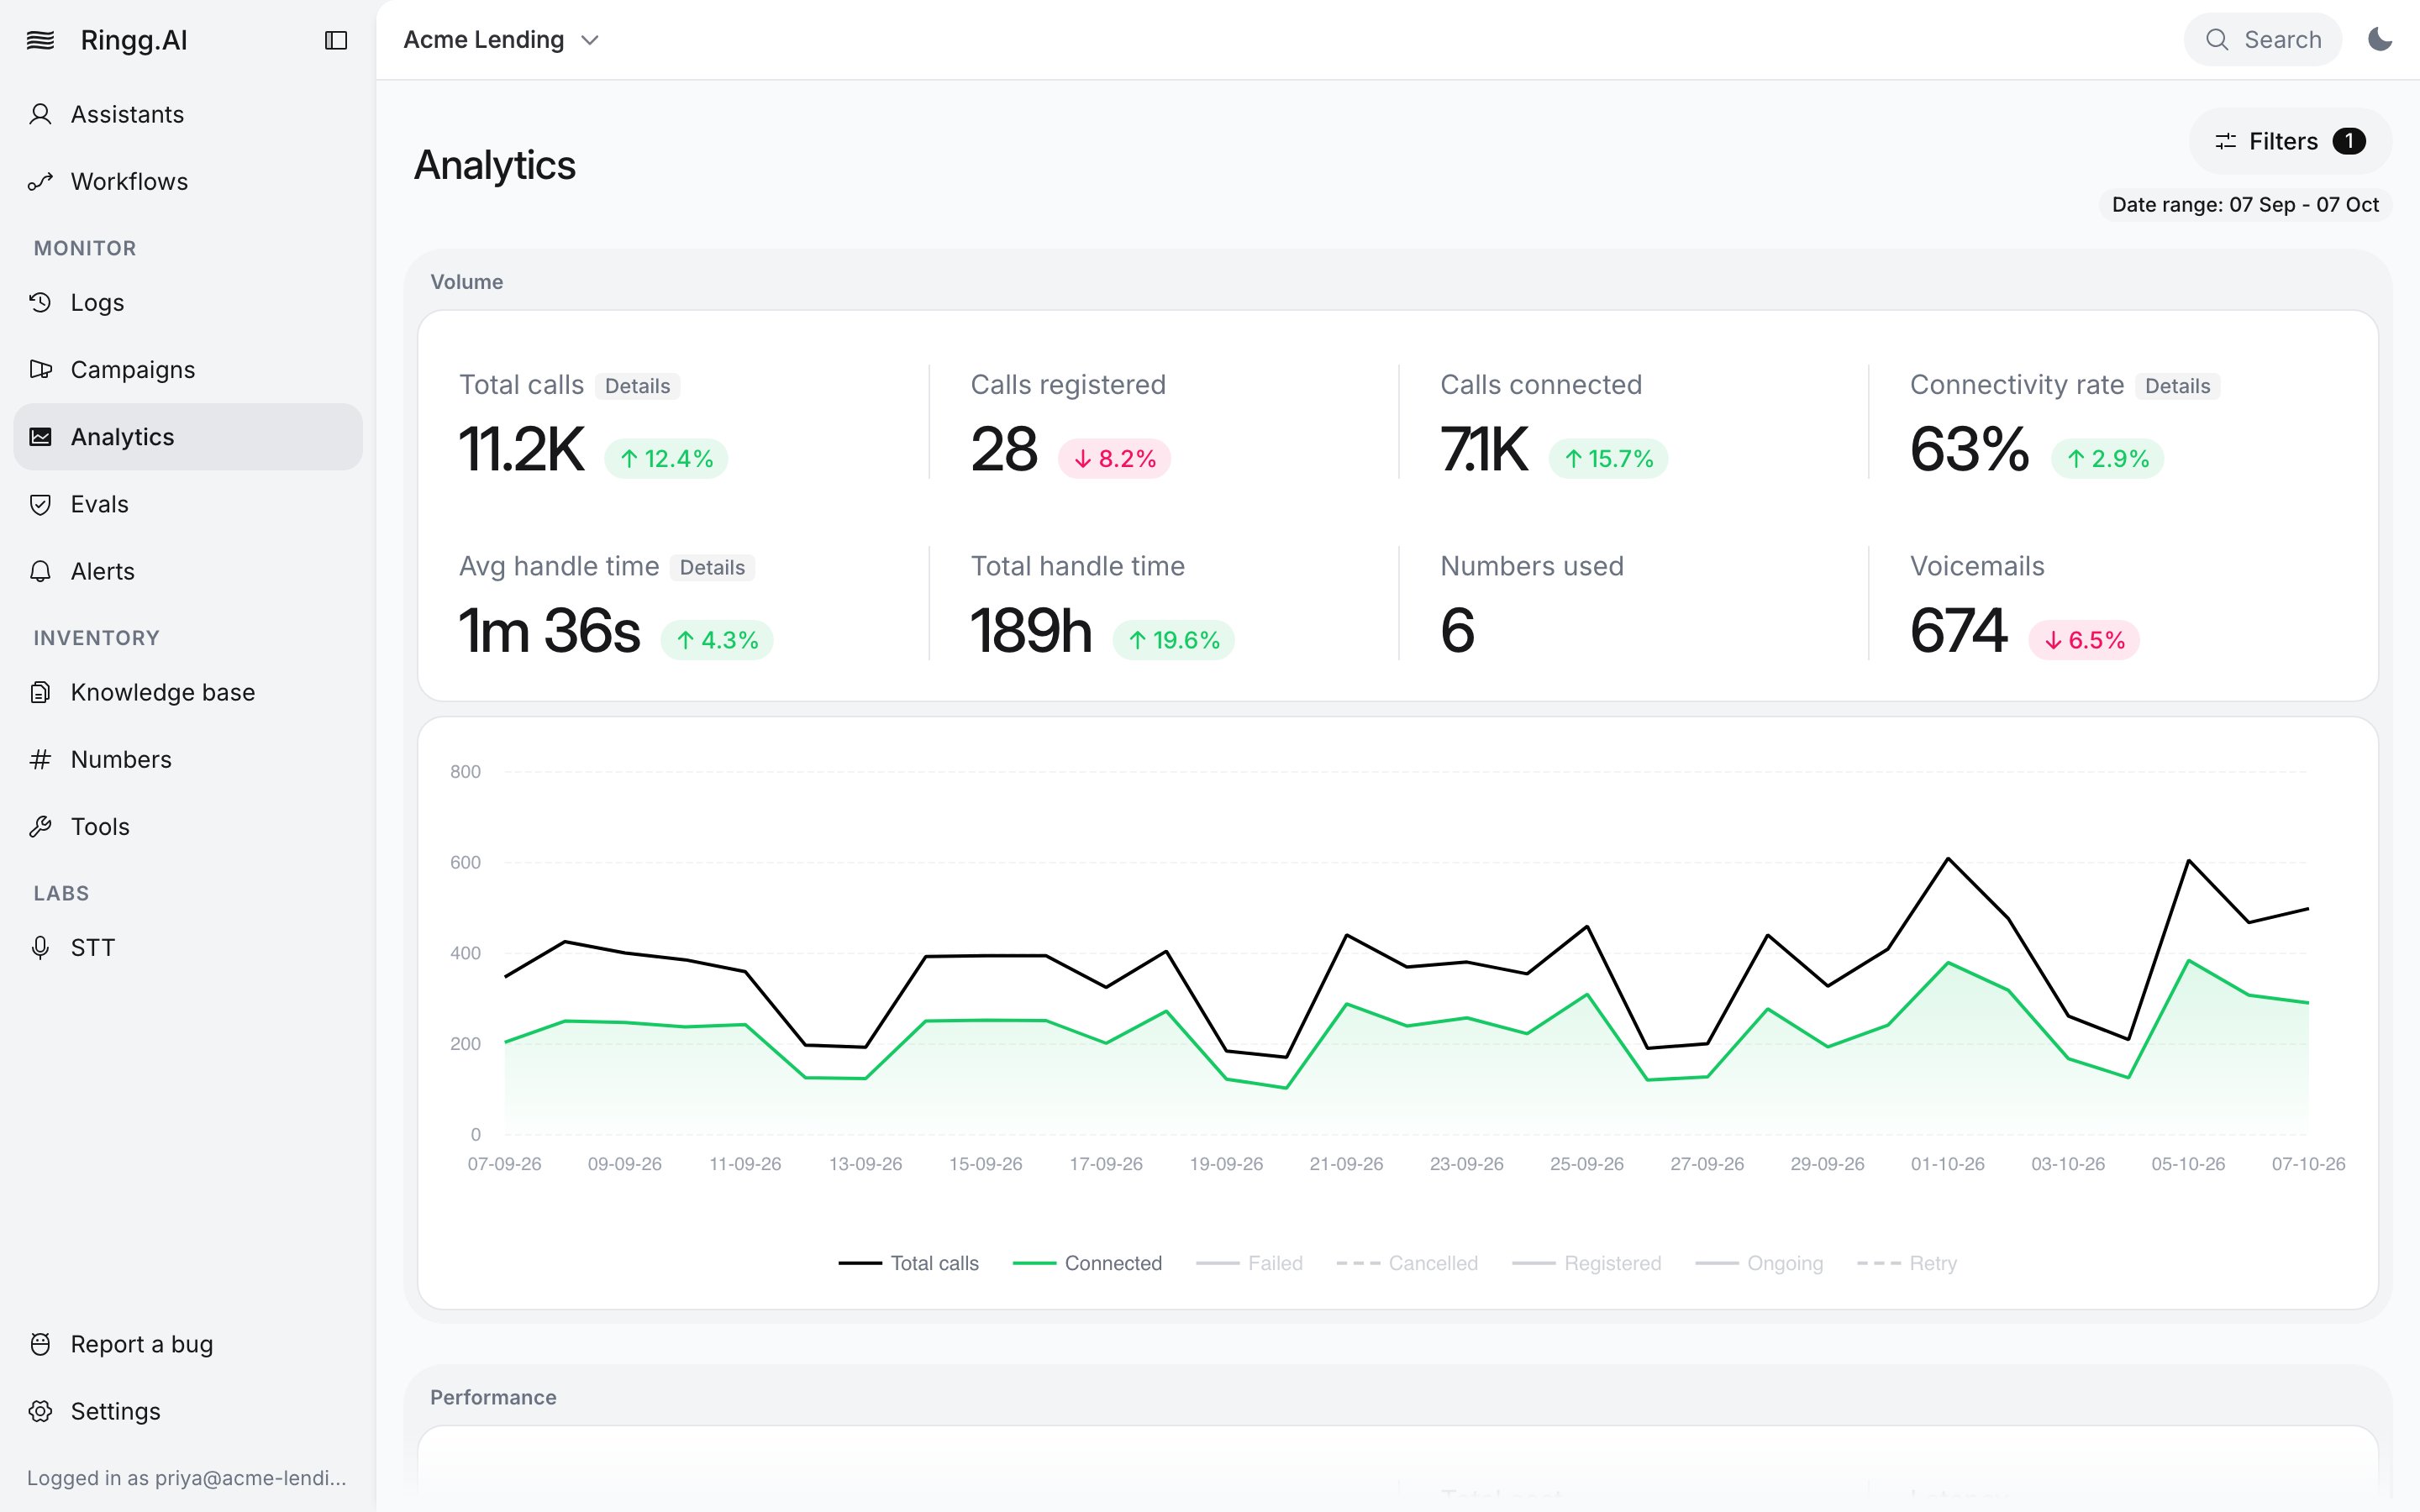
## Volume
Eight cards. Each card except **Numbers used** has a change badge: the relative change against the period of the same length just before the selected range, with the same filters (1–30 Sep compares with 2–31 Aug). For rates such as **Connectivity rate**, the badge is a relative % change, not percentage points. There is no badge when the previous period had no calls, when the change is under 0.1%, or when a campaign is selected. Hover a value for the exact number.
| Card | What it counts | Hover **Details** for |
| - | - | - |
| **Total calls** | All calls in scope | **Callbacks** / **Without callbacks**, and **Campaign** / **API** split |
| **Calls registered** | Calls in the `registered` status ([call statuses](/documentation/monitor/logs#call-statuses)): not dialled yet because they are queued, outside their calling window, held by a call limit or waiting for balance. Also counted in **Total calls**. | |
| **Calls connected** | Calls that connected ([Logs](/documentation/monitor/logs#call-statuses) status **Completed**) | |
| **Connectivity rate** | Connected calls as a share of calls | **Campaign time exhausted** and **Retry exhausted** counts (set by the campaign's end time and retry count, see [Create a campaign](/documentation/deploy/campaigns/create-a-campaign)) |
| **Avg handle time** | Average call duration | Calls by duration: **0–10s**, **10–30s**, **30–60s**, **>60s** |
| **Total handle time** | Sum of call minutes | |
| **Numbers used** | Phone numbers your workspace owns. It doesn't change with the date range or filters. | |
| **Voicemails** | Calls that reached voicemail | |
Below the cards, a trend chart plots calls per hour, day, week or month, depending on the range. **Total calls** and **Connected** are shown by default. Click **Failed**, **Cancelled**, **Registered**, **Ongoing** or **Retry** in the legend to add their lines.
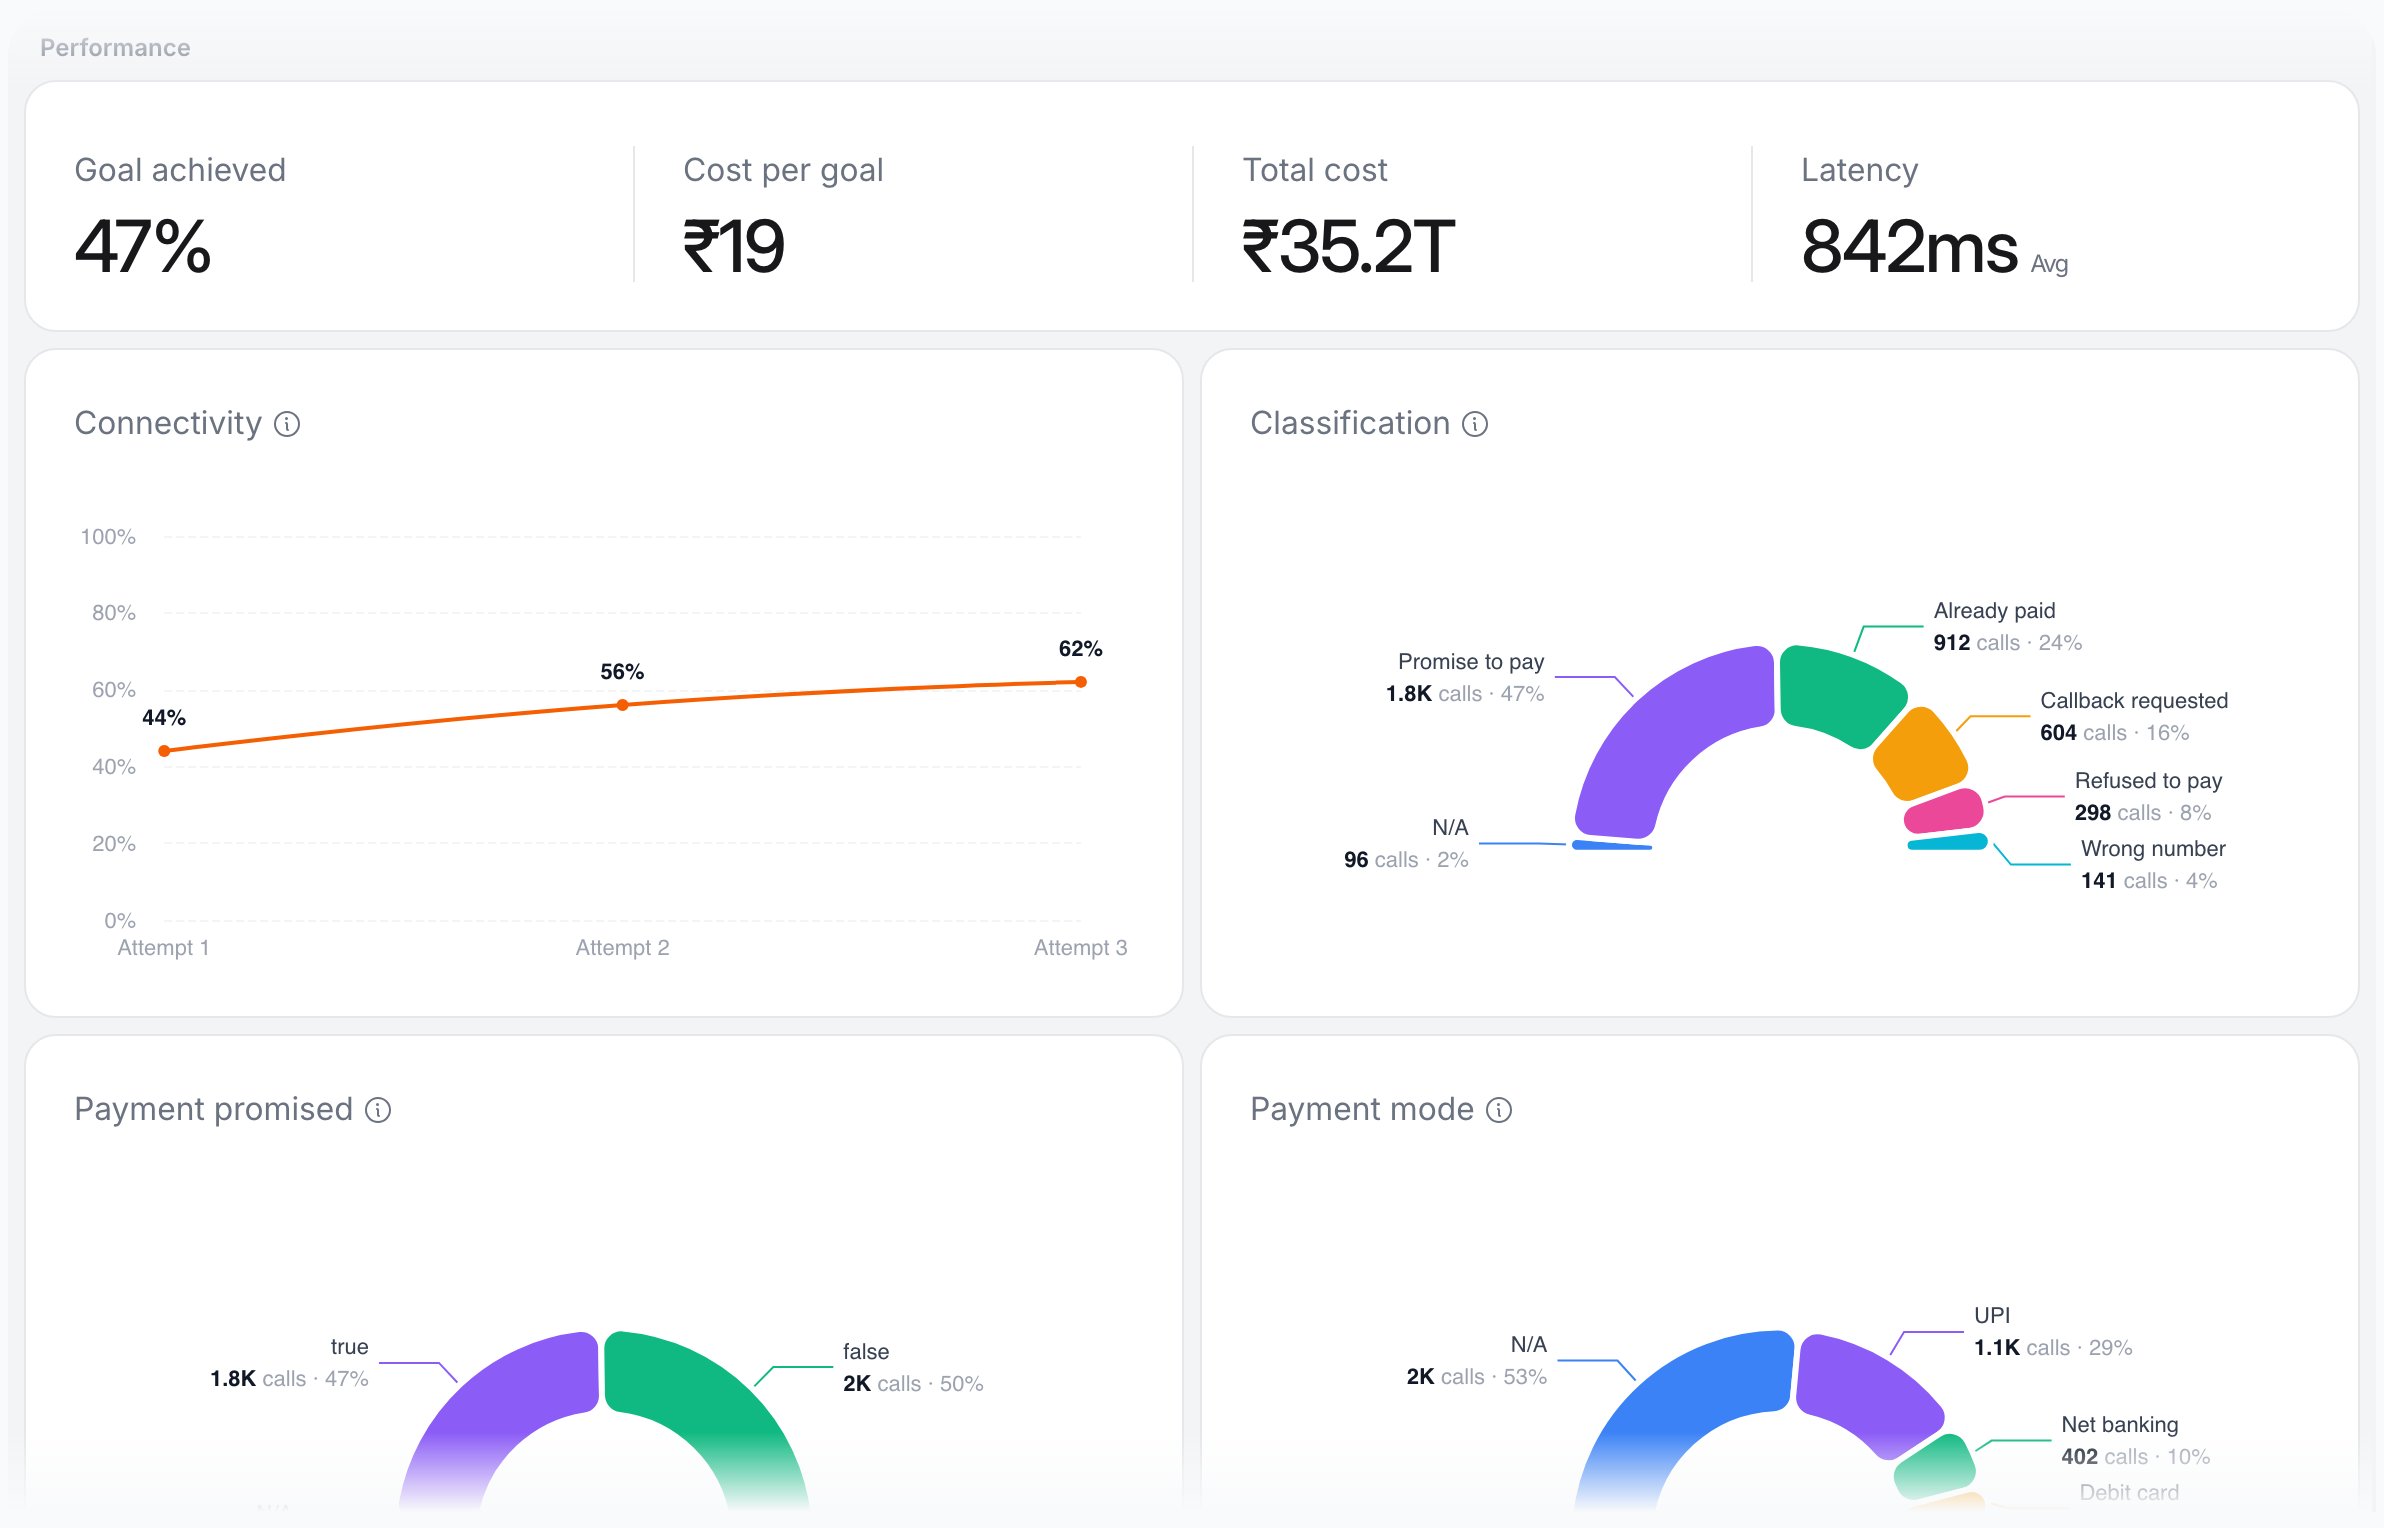
## Performance
| Card | Meaning |
| - | - |
| **Goal achieved** | Calls where the goal field is true, as a share of calls where it has a value. Calls not yet analysed are left out. |
| **Cost per goal** | **Total cost** divided by the number of goals achieved, so it includes connected calls that missed the goal. Shows `-` when no goal was achieved. |
| **Total cost** | Spend on connected (**Completed**) calls in scope, in your account currency ([Billing](/documentation/manage-account/billing)) |
| **Latency** | Average agent response latency, in ms: per call, the median time to first output of speech-to-text, the LLM and text-to-speech, added up, then averaged over calls that have latency data. |
**Goal achieved** and **Cost per goal** appear only after you pick an agent or a campaign. Until then the card reads "Pick an agent to see goal metrics"; click **agent** to open the filter.
### Where the goal comes from
The goal is a Boolean field in the agent's [Advanced Analysis](/documentation/build-agents/customize-agent-behaviour/advanced-analysis). When you add or edit a Boolean variable there, turn on **Use as goal** ("Used by analytics to calculate your agent's success rate."). One variable per agent can be the goal, and it is marked **Goal** in the variables table. Only Boolean variables qualify.
The goal is set per [version](/documentation/build-agents/test-and-improve/drafts-and-versions), and each call is judged against its own version's goal. With several agents selected, **Goal achieved** pools them; calls of versions with no goal are left out. Calls on archived versions don't count toward it.
### Connectivity
A line chart of cumulative connectivity per attempt (**Attempt 1**, **Attempt 2** and so on): the share of calls connected by the end of that attempt. Hover a point to see that attempt's attempted and connected counts. Use it to judge whether more retries are worth it; retries are set on the [campaign](/documentation/deploy/campaigns/create-a-campaign) or [workflow Agent block](/documentation/build-agents/workflows/block-reference#block-reference).
### Cohort analysis
One half-donut per category, showing how connected calls split across its values (top six; **N/A** means the value was missing). Categories are your agent's Boolean and enum Advanced Analysis variables. Hover a slice for connected calls and average handle time. Text and number fields are not charted.
## Call limits
Four counts from your [call limits](/documentation/manage-account/call-limits).
| Card | Meaning (from the tooltip) |
| - | - |
| **Waiting for limit reset** | Held by a limit right now. Each will dial at its next eligible time. |
| **Dialled after waiting** | Held by a limit, then went out once a slot opened. |
| **Cancelled, deadline passed** | No slot opened before the call's own deadline, so it never dialled. |
| **Cancelled, campaign ended** | Still waiting for a slot when their campaign finished, so they never dialled. |
## Agents table
One row per agent active in scope, with **Assistant**, **Calls**, **Connected**, **Minutes** and **Cost**. Rows start sorted by **Calls**; click any number column to sort. The top value in each column is bold.
## Trends
**Concurrency usage** plots **Paid** ("concurrency your workspace bought") against **Received** ("what you used, or the most we could serve"). It follows the date range, campaign and workspace filters only, not agent or channel. Raise paid concurrency on [Billing](/documentation/manage-account/billing#change-concurrency). In a primary workspace, split it across [Ringg Spaces](/documentation/manage-account/ringg-spaces/create-and-manage#concurrency).
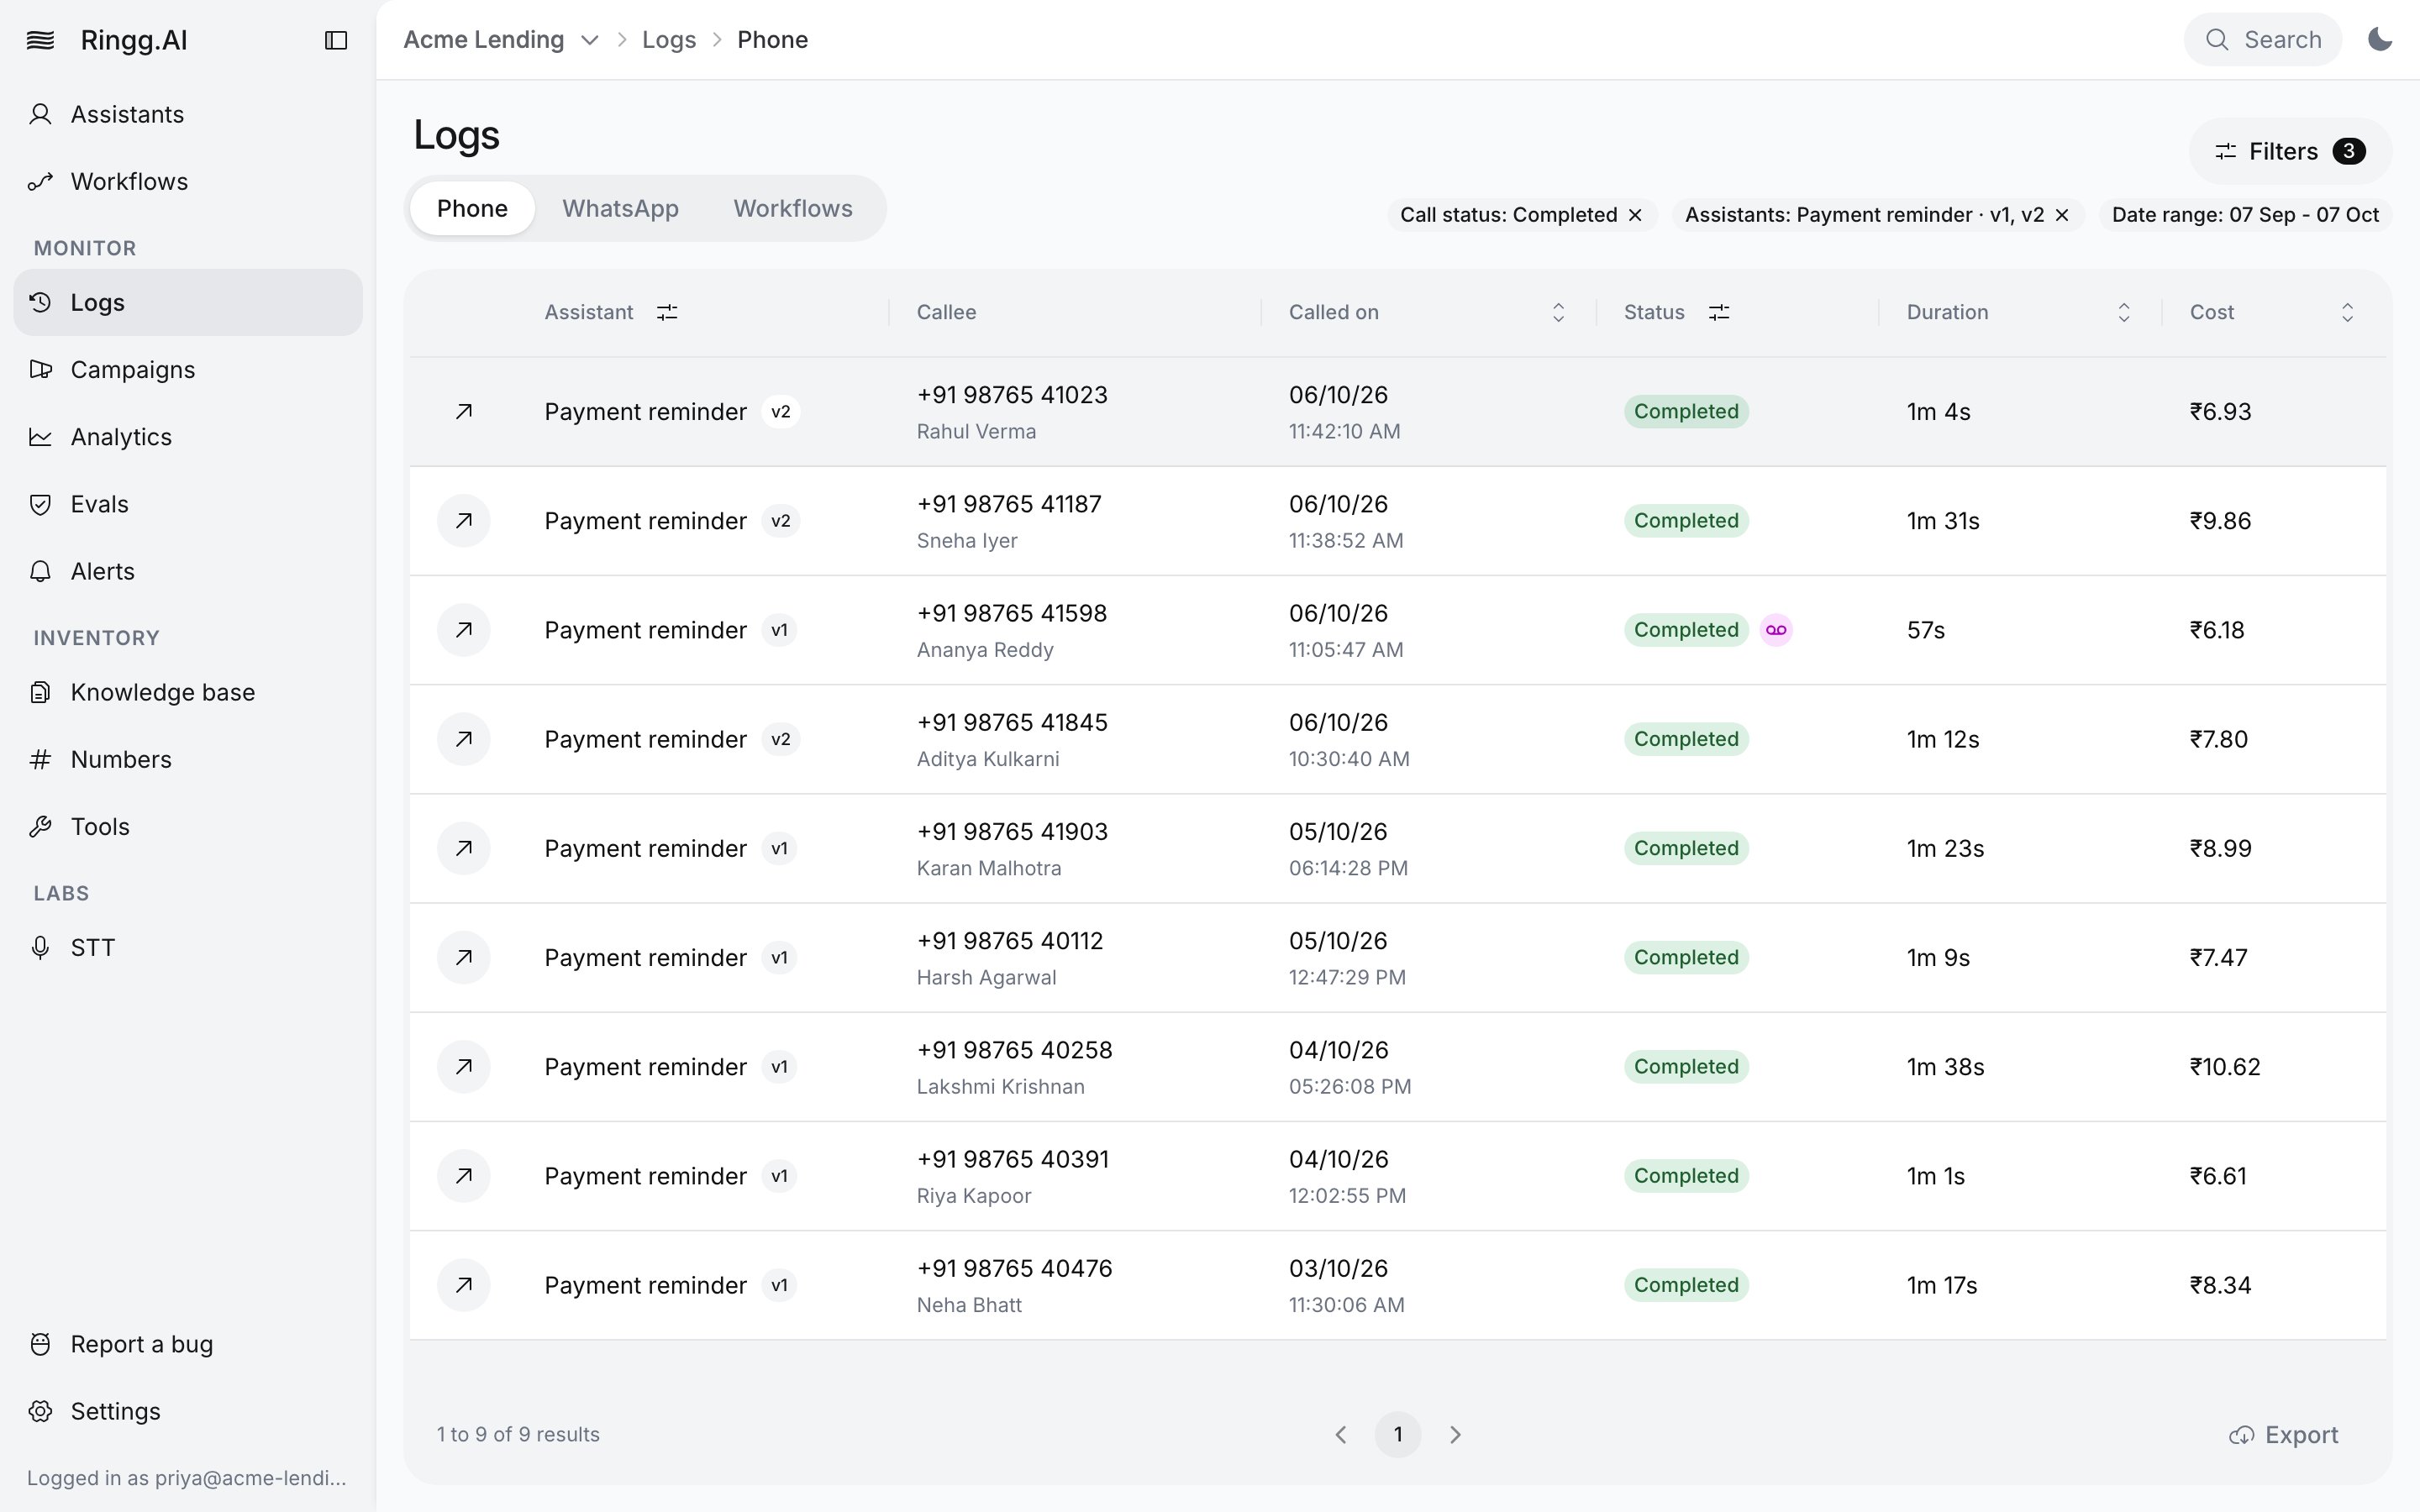
## Drill down into Logs
Some figures open [Logs](/documentation/monitor/logs) with the matching filters. The pointer changes shape over a clickable item.
| Click | Opens Logs filtered to |
| - | - |
| The **Calls connected** value | Status **Completed** |
| The **Voicemails** value | Call type voicemail |
| A point on the Volume trend chart | That period's dates. Clicking near a line also filters by its status, such as **Failed**. Not available when a campaign is selected. |
| A slice of a cohort donut for an Advanced Analysis field | That field's value, status **Completed**. Works only when exactly one agent is selected; **N/A** is not clickable. |
| A row in the agents table | That agent |
Every drill-down keeps the page's date range, agents, versions, campaigns and workspaces. A channel carries over only when exactly one is selected. **Only voicemail** carries over; **Exclude voicemail** and **Include callbacks** do not, because Logs has no matching filter. Other cards, the connectivity chart, call limits and concurrency are not clickable.
## Act on what you see
| If you see | Try |
| - | - |
| Low **Connectivity rate** | Check the caller numbers ([spam flags in a pool](/documentation/inventory/phone-numbers/number-pools)), the [calling windows](/documentation/deploy/campaigns/create-a-campaign#calling-windows-rules) and the list quality. |
| Many **Voicemails** | Move the calling windows to hours when contacts answer. |
| Low **Avg handle time** | Listen to short calls in [Logs](/documentation/monitor/logs) and rework the agent's opening in its [prompt](/documentation/build-agents/customize-agent-behaviour/agent-prompt). |
| High **Cost per goal** | Compare agents in the agents table, and review the prompt and list targeting of the weaker one. |
## Download report and Share feedback
* **Download report** (bottom right) saves the whole page as a PDF with the current filters and theme, named `analytics-report--to-.pdf`, or `analytics-report-campaign.pdf` when a campaign is selected.
* **Share feedback** opens a drawer: write in **Your suggestion** ("Any metric or chart you wish existed.") and click **Share**.
## With the API
The public API has five analytics endpoints. Each takes `start_date` and `end_date` (`YYYY-MM-DD`), `agent_id`, `bulk_list_id` and `voicemail`. They don't match the dashboard cards: they leave out **Cancelled** and **Error** calls, include callbacks, count unique numbers actually used, and have no registered count, change, goal, cost or latency figures. Expect their totals to differ from the page.
* [Get Platform Analytics](/api-reference/endpoint/analytics/get-platform-analytics): workspace summary metrics.
* [Get Drill-Down Analytics](/api-reference/endpoint/analytics/get-drill-down-analytics): one campaign (`bulk_list_id` required).
* [Get Number Analytics](/api-reference/endpoint/analytics/get-number-analytics): metrics per phone number.
* [Get Duration Distribution](/api-reference/endpoint/analytics/get-duration-distribution): call duration buckets.
* [Get Classification Analytics](/api-reference/endpoint/analytics/get-classification-analytics): calls by outcome classification.
You need an [API key](/documentation/manage-account/api-key) sent as `X-API-KEY` (see [Authentication](/api-reference/introduction/authentication)). Get an agent's ID from [Find an agent's ID](/documentation/build-agents/agents/agent-types#find-the-agent-id).
```bash cURL theme={null}
curl --request GET "https://prod-api.ringg.ai/ca/api/v0/analytics/platform-analytics?start_date=2026-09-01&end_date=2026-09-30&agent_id=123e4567-e89b-12d3-a456-426614174000" \
--header "X-API-KEY: $RINGG_API_KEY"
```
```javascript JavaScript theme={null}
const params = new URLSearchParams({
start_date: "2026-09-01",
end_date: "2026-09-30",
agent_id: "123e4567-e89b-12d3-a456-426614174000",
});
const response = await fetch(
`https://prod-api.ringg.ai/ca/api/v0/analytics/platform-analytics?${params}`,
{ headers: { "X-API-KEY": process.env.RINGG_API_KEY } }
);
console.log(await response.json());
```
```python Python theme={null}
import os
import requests
response = requests.get(
"https://prod-api.ringg.ai/ca/api/v0/analytics/platform-analytics",
params={
"start_date": "2026-09-01",
"end_date": "2026-09-30",
"agent_id": "123e4567-e89b-12d3-a456-426614174000",
},
headers={"X-API-KEY": os.environ["RINGG_API_KEY"]},
)
print(response.json())
```
For call-level rows, use [Get call history](/api-reference/endpoint/history/get-call-history).
## Troubleshooting
Pick an agent or a campaign in **Filters**. If they show `-`, the agent has no goal: set **Use as goal** on a Boolean variable in [Advanced Analysis](/documentation/build-agents/customize-agent-behaviour/advanced-analysis). **Cost per goal** also shows `-` when no call achieved the goal.
A campaign scopes the page to all its calls, whenever they happened. Remove the campaign to filter by date again.
Check **Callbacks**: Analytics leaves callback calls out unless **Include callbacks** is ticked. Also check the timezone: Analytics uses your browser's.
Select exactly one agent. **N/A** slices never open Logs.
## Next steps
Score calls and run test cases with Evals.
Notify your team when a metric crosses a threshold.
This documentation is built and hosted on [Mintlify](https://mintlify.com), a developer documentation platform.
 ## Performance
| Card | Meaning |
| - | - |
| **Goal achieved** | Calls where the goal field is true, as a share of calls where it has a value. Calls not yet analysed are left out. |
| **Cost per goal** | **Total cost** divided by the number of goals achieved, so it includes connected calls that missed the goal. Shows `-` when no goal was achieved. |
| **Total cost** | Spend on connected (**Completed**) calls in scope, in your account currency ([Billing](/documentation/manage-account/billing)) |
| **Latency** | Average agent response latency, in ms: per call, the median time to first output of speech-to-text, the LLM and text-to-speech, added up, then averaged over calls that have latency data. |
**Goal achieved** and **Cost per goal** appear only after you pick an agent or a campaign. Until then the card reads "Pick an agent to see goal metrics"; click **agent** to open the filter.
## Performance
| Card | Meaning |
| - | - |
| **Goal achieved** | Calls where the goal field is true, as a share of calls where it has a value. Calls not yet analysed are left out. |
| **Cost per goal** | **Total cost** divided by the number of goals achieved, so it includes connected calls that missed the goal. Shows `-` when no goal was achieved. |
| **Total cost** | Spend on connected (**Completed**) calls in scope, in your account currency ([Billing](/documentation/manage-account/billing)) |
| **Latency** | Average agent response latency, in ms: per call, the median time to first output of speech-to-text, the LLM and text-to-speech, added up, then averaged over calls that have latency data. |
**Goal achieved** and **Cost per goal** appear only after you pick an agent or a campaign. Until then the card reads "Pick an agent to see goal metrics"; click **agent** to open the filter.
 ### Where the goal comes from
The goal is a Boolean field in the agent's [Advanced Analysis](/documentation/build-agents/customize-agent-behaviour/advanced-analysis). When you add or edit a Boolean variable there, turn on **Use as goal** ("Used by analytics to calculate your agent's success rate."). One variable per agent can be the goal, and it is marked **Goal** in the variables table. Only Boolean variables qualify.
The goal is set per [version](/documentation/build-agents/test-and-improve/drafts-and-versions), and each call is judged against its own version's goal. With several agents selected, **Goal achieved** pools them; calls of versions with no goal are left out. Calls on archived versions don't count toward it.
### Connectivity
A line chart of cumulative connectivity per attempt (**Attempt 1**, **Attempt 2** and so on): the share of calls connected by the end of that attempt. Hover a point to see that attempt's attempted and connected counts. Use it to judge whether more retries are worth it; retries are set on the [campaign](/documentation/deploy/campaigns/create-a-campaign) or [workflow Agent block](/documentation/build-agents/workflows/block-reference#block-reference).
### Cohort analysis
One half-donut per category, showing how connected calls split across its values (top six; **N/A** means the value was missing). Categories are your agent's Boolean and enum Advanced Analysis variables. Hover a slice for connected calls and average handle time. Text and number fields are not charted.
## Call limits
Four counts from your [call limits](/documentation/manage-account/call-limits).
| Card | Meaning (from the tooltip) |
| - | - |
| **Waiting for limit reset** | Held by a limit right now. Each will dial at its next eligible time. |
| **Dialled after waiting** | Held by a limit, then went out once a slot opened. |
| **Cancelled, deadline passed** | No slot opened before the call's own deadline, so it never dialled. |
| **Cancelled, campaign ended** | Still waiting for a slot when their campaign finished, so they never dialled. |
## Agents table
One row per agent active in scope, with **Assistant**, **Calls**, **Connected**, **Minutes** and **Cost**. Rows start sorted by **Calls**; click any number column to sort. The top value in each column is bold.
## Trends
**
### Where the goal comes from
The goal is a Boolean field in the agent's [Advanced Analysis](/documentation/build-agents/customize-agent-behaviour/advanced-analysis). When you add or edit a Boolean variable there, turn on **Use as goal** ("Used by analytics to calculate your agent's success rate."). One variable per agent can be the goal, and it is marked **Goal** in the variables table. Only Boolean variables qualify.
The goal is set per [version](/documentation/build-agents/test-and-improve/drafts-and-versions), and each call is judged against its own version's goal. With several agents selected, **Goal achieved** pools them; calls of versions with no goal are left out. Calls on archived versions don't count toward it.
### Connectivity
A line chart of cumulative connectivity per attempt (**Attempt 1**, **Attempt 2** and so on): the share of calls connected by the end of that attempt. Hover a point to see that attempt's attempted and connected counts. Use it to judge whether more retries are worth it; retries are set on the [campaign](/documentation/deploy/campaigns/create-a-campaign) or [workflow Agent block](/documentation/build-agents/workflows/block-reference#block-reference).
### Cohort analysis
One half-donut per category, showing how connected calls split across its values (top six; **N/A** means the value was missing). Categories are your agent's Boolean and enum Advanced Analysis variables. Hover a slice for connected calls and average handle time. Text and number fields are not charted.
## Call limits
Four counts from your [call limits](/documentation/manage-account/call-limits).
| Card | Meaning (from the tooltip) |
| - | - |
| **Waiting for limit reset** | Held by a limit right now. Each will dial at its next eligible time. |
| **Dialled after waiting** | Held by a limit, then went out once a slot opened. |
| **Cancelled, deadline passed** | No slot opened before the call's own deadline, so it never dialled. |
| **Cancelled, campaign ended** | Still waiting for a slot when their campaign finished, so they never dialled. |
## Agents table
One row per agent active in scope, with **Assistant**, **Calls**, **Connected**, **Minutes** and **Cost**. Rows start sorted by **Calls**; click any number column to sort. The top value in each column is bold.
## Trends
** ## Act on what you see
| If you see | Try |
| - | - |
| Low **Connectivity rate** | Check the caller numbers ([spam flags in a pool](/documentation/inventory/phone-numbers/number-pools)), the [calling windows](/documentation/deploy/campaigns/create-a-campaign#calling-windows-rules) and the list quality. |
| Many **Voicemails** | Move the calling windows to hours when contacts answer. |
| Low **Avg handle time** | Listen to short calls in [Logs](/documentation/monitor/logs) and rework the agent's opening in its [prompt](/documentation/build-agents/customize-agent-behaviour/agent-prompt). |
| High **Cost per goal** | Compare agents in the agents table, and review the prompt and list targeting of the weaker one. |
## Download report and Share feedback
* **Download report** (bottom right) saves the whole page as a PDF with the current filters and theme, named `analytics-report-
## Act on what you see
| If you see | Try |
| - | - |
| Low **Connectivity rate** | Check the caller numbers ([spam flags in a pool](/documentation/inventory/phone-numbers/number-pools)), the [calling windows](/documentation/deploy/campaigns/create-a-campaign#calling-windows-rules) and the list quality. |
| Many **Voicemails** | Move the calling windows to hours when contacts answer. |
| Low **Avg handle time** | Listen to short calls in [Logs](/documentation/monitor/logs) and rework the agent's opening in its [prompt](/documentation/build-agents/customize-agent-behaviour/agent-prompt). |
| High **Cost per goal** | Compare agents in the agents table, and review the prompt and list targeting of the weaker one. |
## Download report and Share feedback
* **Download report** (bottom right) saves the whole page as a PDF with the current filters and theme, named `analytics-report-